Write interpretation here…
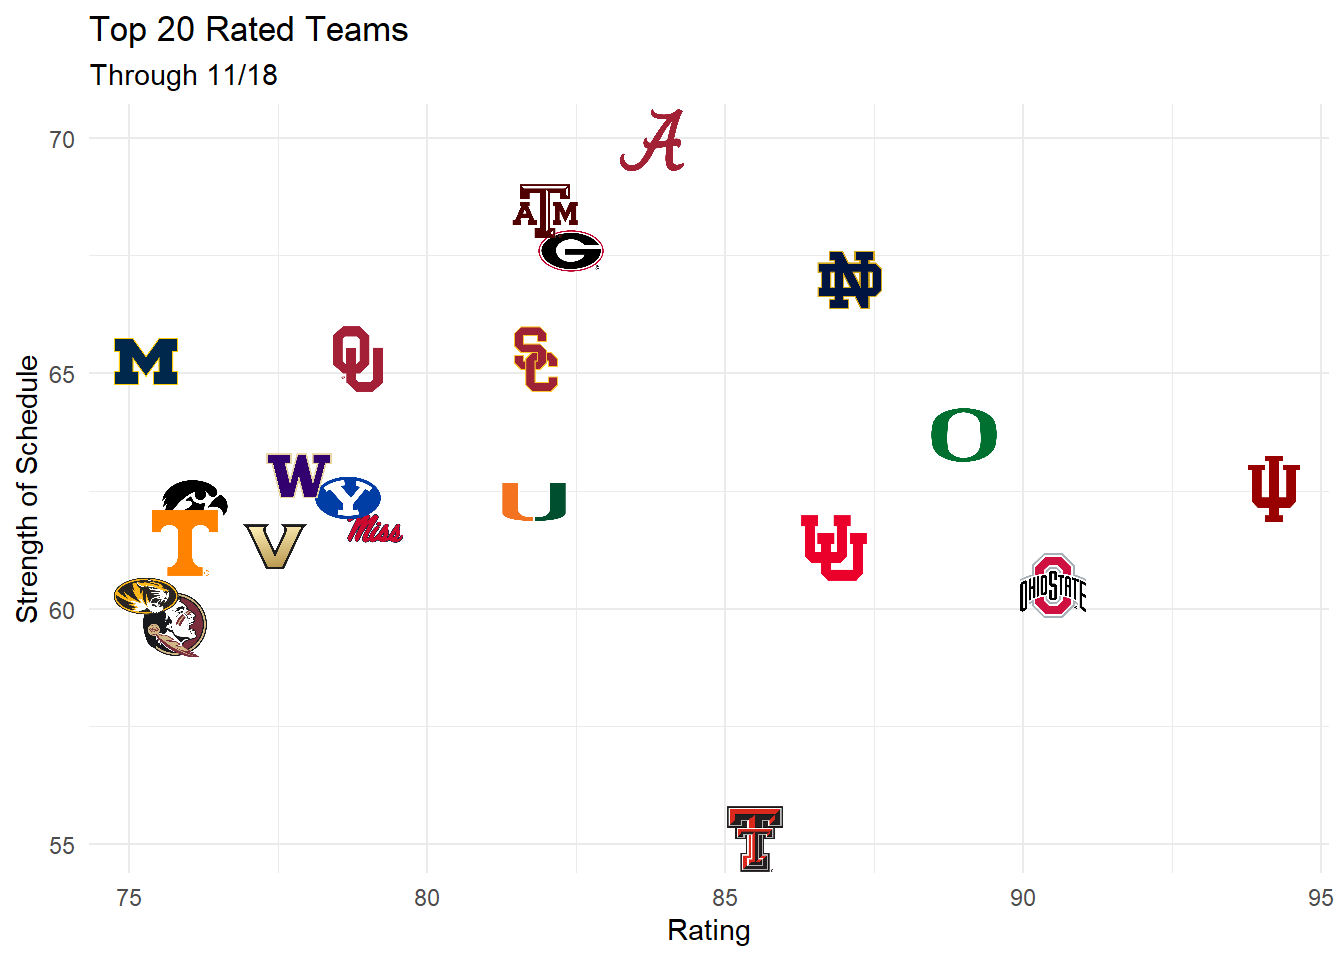
| Massey Ratings – FBS 2025 (Top 40) | ||||
| Based on least squares solution to a system of equations | ||||
| Rank | Team | Rating | Strength of Schedule | |
|---|---|---|---|---|
| 1 |  |
Indiana | 94.19 | 62.55 |
| 2 |  |
Ohio State | 90.49 | 60.49 |
| 3 |  |
Oregon | 88.99 | 63.69 |
| 4 |  |
Notre Dame | 87.09 | 66.99 |
| 5 |  |
Utah | 86.81 | 61.31 |
| 6 |  |
Texas Tech | 85.48 | 55.12 |
| 7 |  |
Alabama | 83.76 | 69.96 |
| 8 |  |
Georgia | 82.41 | 67.61 |
| 9 |  |
Texas A&M | 81.95 | 68.45 |
| 10 |  |
USC | 81.81 | 65.31 |
| 11 |  |
Miami | 81.77 | 62.27 |
| 12 |  |
Ole Miss | 79.04 | 62.04 |
| 13 |  |
Oklahoma | 78.82 | 65.32 |
| 14 |  |
BYU | 78.66 | 62.36 |
| 15 |  |
Washington | 77.83 | 62.83 |
| 16 |  |
Vanderbilt | 77.42 | 61.32 |
| 17 |  |
Iowa | 76.10 | 62.30 |
| 18 |  |
Tennessee | 75.92 | 61.42 |
| 19 |  |
Florida State | 75.76 | 59.66 |
| 20 |  |
Missouri | 75.27 | 60.27 |
| 21 |  |
Michigan | 75.27 | 65.27 |
| 22 |  |
Penn State | 74.51 | 65.21 |
| 23 |  |
Illinois | 74.10 | 65.80 |
| 24 |  |
Texas | 73.94 | 64.64 |
| 25 |  |
LSU | 72.90 | 68.60 |
| 26 |  |
South Florida | 72.03 | 56.33 |
| 27 |  |
North Texas | 71.48 | 50.28 |
| 28 |  |
Pittsburgh | 71.10 | 57.20 |
| 29 |  |
Auburn | 70.63 | 67.13 |
| 30 |  |
Arizona | 70.56 | 58.16 |
| 31 |  |
Nebraska | 69.90 | 57.30 |
| 32 |  |
Kentucky | 69.16 | 66.36 |
| 33 |  |
Virginia | 68.74 | 56.20 |
| 34 |  |
Louisville | 68.45 | 58.45 |
| 35 |  |
Iowa State | 68.02 | 62.42 |
| 36 |  |
Cincinnati | 67.99 | 56.29 |
| 37 |  |
South Carolina | 67.99 | 70.29 |
| 38 |  |
SMU | 67.45 | 55.65 |
| 39 |  |
Florida | 67.09 | 69.89 |
| 40 |  |
James Madison | 66.93 | 46.03 |
| 11/22 Matchups (top 20 teams) | |||||||
| Projected spreads | |||||||
| Away | Home | Away Rating | Home Rating | Margin (neutral field) | Margin (lazy home field adv) | ||
|---|---|---|---|---|---|---|---|
|
Florida State |  |
NC State | 75.76 | 62.26 | 13.50 | 10.50 |
|
Miami |  |
Virginia Tech | 81.77 | 55.59 | 26.19 | 23.19 |
 |
Samford | |
Texas A&M | 10.81 | 81.95 | −71.14 | −74.14 |
 |
Rutgers | |
Ohio State | 60.55 | 90.49 | −29.94 | −32.94 |
|
Missouri | |
Oklahoma | 75.27 | 78.82 | −3.54 | −6.54 |
 |
Charlotte | |
Georgia | 33.47 | 82.41 | −48.94 | −51.94 |
 |
Eastern Illinois | |
Alabama | 17.36 | 83.76 | −66.41 | −69.41 |
|
USC | |
Oregon | 81.81 | 88.99 | −7.19 | −10.19 |
|
Kentucky | |
Vanderbilt | 69.16 | 77.42 | −8.27 | −11.27 |
 |
Michigan State | |
Iowa | 58.72 | 76.10 | −17.38 | −20.38 |
 |
Syracuse | |
Notre Dame | 52.81 | 87.09 | −34.28 | −37.28 |
|
Michigan |  |
Maryland | 75.27 | 60.83 | 14.44 | 11.44 |
 |
Kansas State | |
Utah | 64.62 | 86.81 | −22.19 | −25.19 |
|
Tennessee | |
Florida | 75.92 | 67.09 | 8.83 | 5.83 |
|
BYU | |
Cincinnati | 78.66 | 67.99 | 10.67 | 7.67 |
|
Washington |  |
UCLA | 77.83 | 58.00 | 19.83 | 16.83 |